With custom reports, schools can generate specific data analyses related to student performance, attendance, and financials based on their unique needs.
Dashboards provide an intuitive interface for monitoring key metrics and trends, making data interpretation straightforward and actionable. Automated updates ensure that information is current, and customizable views cater to different roles, from administrators to teachers.
This capability improves decision-making, enhances transparency, and supports strategic planning by providing clear, actionable insights.
Suggested New Idea
-
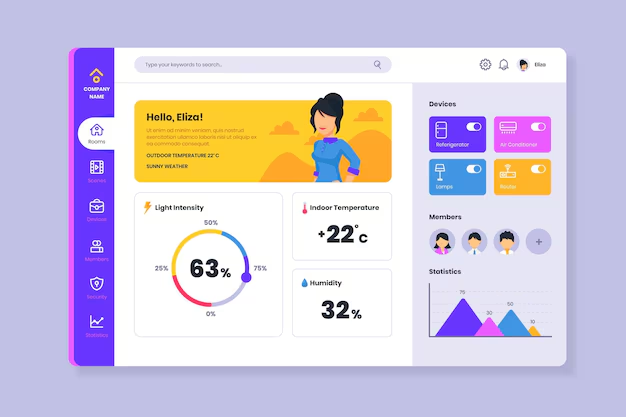
Interactive Data Visualization Tools
ERP software could incorporate interactive data visualization tools, allowing users to explore data through dynamic charts and graphs. By enabling drill-down features and customizable views, schools can gain deeper insights and better understand complex data trends, leading to more informed decisions.